

|
AMPOL provides unparalleled post-analysis tools, for analyzing avionics data recorded by a variety of flight-data recorders. Regardless of the means used to capture data, the generic dataMARS provides you with powerful tools to view, analyze and export your data. |
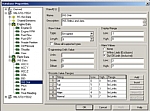 The dataMARS and dataSIMS products use an ICD database to enable extraction of engineering-unit data from monitored and replayed communication messages. This database describes the data format of individual types of messages, as well as the engineering-unit elements they contain. The mapping and encoding details of these elements are then used to decode their engineering-unit values during monitoring and replay. These values are displayed in graphical and numerical displays, and are also presented in the different report types supported by the software. Engineering-unit element settings also enable detection of illegal (alarm) element values and mapping of values to text. When simulating engineering-unit data via dataSIMS, the ICD encodes the data into a transmitted raw message.
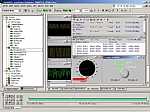 The dataMARS and dataSIMS offer superb post-analysis capabilities for recorded data. Supported recordings include those created by dataMARS, dataSIMS and the dataMARS104-II systems. Recordings made by recorders from other vendors may also be imported for analysis.
Post-analysis is performed on engineering-unit values decoded from the recorded data, which are displayed using a variety of presentation formats, and reported in flexible reporting formats. Specific events and conditions can be searched for in the recorded data, and calculations may be performed on it to extract new information to be displayed and reported alongside the recorded data. Recorded data may be exported to other third-party tools, such as Excel™ and MatLab™.
Data from multiple sources are replayed synchronously, based on recorded time tags. The data may be replayed at various rates, such as 1:1 and full speed.
Aside from the engineering displays that show recorded data, virtual panels can be used to reflect the pilot's activities while the recording was made, according to the recorded data. For example, knobs will automatically turn and switches will be toggled, as if operated by the pilot.
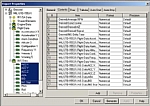 A variety of ASCII reports can be generated from the recorded data. These include engineering-unit values, results of additional calculations based on monitored data and the raw data of complete messages. Reports may be generated for either complete recordings or for selected portions of them. Report templates may be used to generate multiple reports for numerous data recordings in a single batch process.
Use other optional conversion tools to convert recorded data to various third party binary formats.
Reported data may be used in Excel™, MatLab™ and other tools for dedicated analysis and presentation. Reports may also be distributed to other interested parties.
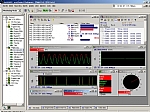 The dataMARS and dataSIMS visualize recorded and replayed data using a wide variety of graphical and alphanumeric displays. They offer display formats that show engineering-unit values in plots, needles, bars and numbers, as well as display formats that show the complete messages and sequences of messages.
You can create display setups that include multiple display pages with hundreds of displays for elements, messages and streams, without losing speed and efficiency.
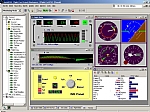 Virtual Panels are a major add-on package option that simplifies access to monitored and simulated data by constructing realistic looking front panels from an extensive library of gadgets. You can use these panels to control a real piece of equipment, as well as simulate or create virtual equipment that can communicate on a live bus. Virtual Panels can also be useful in emulating and testing a proposed front panel design, in order to simplify the user interface for data monitoring. Virtual panels may be extended to include new types of displays and ActiveX controls. A provided SDK allows the creation of custom controls.
Virtual Panels are useful in mimicking the look, feel and operation of real equipment used by the pilot by presenting the recorded data via "real-life" controls. The intuitive interface is especially helpful for users who are not familiar with the dataMARS and dataSIMS systems.
 A special data conversion tool enables the import of recorded data from other vendors' recorders (e.g. TEAC/Merlin, Calculex and Smiths Industries Aerospace) to the dataMARS recording format, which allows them to benefit from the superior post-analysis capabilities offered by this system. The data conversion tool can also combine recordings from multiple sources into a single synchronized recording.
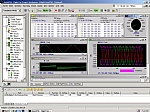 The dataMARS and dataSIMS make it possible to incorporate and integrate custom data communications channels into the system in order to utilize its monitoring, display, storage, post-analysis and database capabilities. They provide you with a driver (with full source code) that you can easily modify to receive and transmit custom data. This driver may be used for the monitoring of custom hardware, custom RS232/422 protocols, GPS data, analog I/O and more.
Custom data are monitored and simulated alongside standard protocols (for example, MIL-STD-1553 or ARINC-429), which re-emphasizes the complete and system-wide approach taken by the dataMARS and dataSIMS.
dataMARS provides an interface by which it can be used concurrently with other analysis tools in a synchronized manner.
You can benefit from its powerful features while controlling dataMARS operation via a software interface (API).